Financial Performance
GRI: 201-1
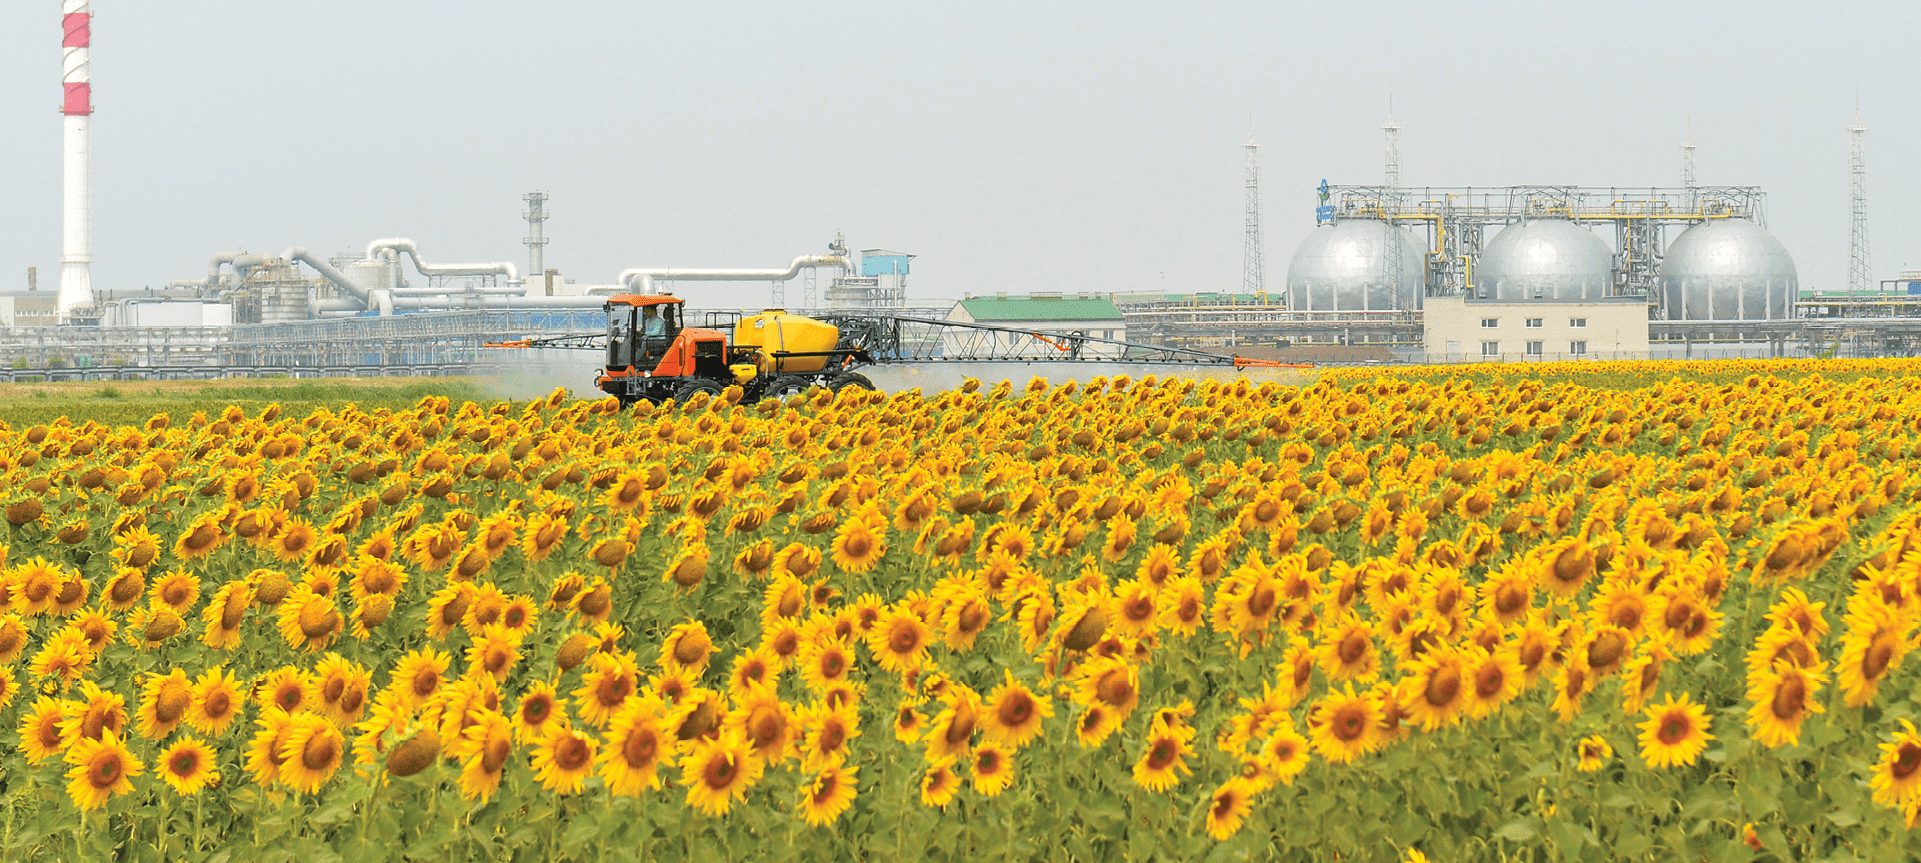
 In 2019, PhosAgro confirmed its status as one of the world’s most efficient producers of phosphate-based fertilizers. Despite the unfavourable pricing environment, our key financial indicators are on a steady growth path with revenue up by 6.3% y-o-y to RUB 248 bln and cost of sales adding 9.9% y-o-y to reach RUB 136 bln. EBITDA margin remains at a robust 30.5%.Alexander Sharabaiko, Deputy CEO for Finance and International Projects
2019 was a challenging year for the fertilizer market. Prices for our products came under pressure throughout the year due to adverse weather conditions in key sales markets, as well as increased global supply amid stable demand. As a result, prices for phosphate-based fertilizers reached near-record lows at the end of the year.
Despite the challenging pricing environment, PhosAgro was able to increase sales volumes and revenue by 7.1% and 6.3% y-o-y, respectively. Our strong revenue growth was driven by a balanced approach to investment and maintenance, high levels of self-sufficiency in key inputs, a flexible sales policy and the exceptional quality of our own ore.
As a result, the Company’s EBITDA exceeded RUB 75 bln in 2019, with an EBITDA margin of 30.5%. Free cash flow increased by almost 40% y-o-y to more than RUB 28 bln.
Strong financial performance meant PhosAgro was able not only to fully self-finance its annual capex programme but also to improve debt ratios. At the end of 2019, net debt stood at RUB 132 bln, while the net debt/EBITDA ratio improved to 1.7x (compared with 1.8x at the end of 2018).
Our excellent financial performance and comfortable debt level enabled us to pay out respectable dividends. Based on 2019 results, the Company will pay out dividends of RUB 24.9 bln, which corresponds to 88% of its free cash flow for the year.
Since the beginning of 2020, we have seen a considerable recovery in prices for phosphate-based fertilizers amid the approaching spring season, production cutbacks announced by a number of major players and the relative accessibility of fertilizers. There is also a risk of reduced fertilizer supply from China.
The recovery in prices, combined with an anticipated increase in demand in markets where the Company has strong positions (Russia, Eastern Europe and Latin America) position us well to expect increased sales volumes while maintaining high levels of profitability.
In 2019, PhosAgro’s revenue went up by 6.3% y-o-y to RUB 248.1 bln, mainly driven by a 7.0% increase in fertilizer sales y-o-y. However, revenue growth was slowed by phosphate-based fertilizer price correction that continued throughout the year.
During the year, fertilizers were mainly exported to regions with the best pricing environment compared to the North American market, where prolonged adverse weather conditions led to an increase in fertilizer stockpiles. As at the end of 2019, PhosAgro increased deliveries to the Russian and CIS markets (up 11% y-o-y), as well as the European market (up 28% y-o-y). This growth was strongly supported by a well-developed distribution system and a favourable pricing balance between agricultural products and fertilizers.
Gross profit in 2019 increased by 2.4% y-o-y and amounted to RUB 111.9 bln (USD 1.7 bln), with a gross profit margin of 45%, down from 47% in 2018. Gross profit and gross profit margin in the phosphate-based and nitrogen fertilizer segments changed as follows:
- Gross profit for phosphate-based fertilizers increased by 2.4% to RUB 90.2 bln (USD 1.4 bln), while the gross profit margin decreased to 45% (from 47% in 2018) as global prices dropped to a 13-year minimum in 4Q 2019.
- Gross profit for the nitrogen segment grew by 3.4% and stood at RUB 21.3 bln (USD 329 mln), with a gross profit margin of 56%, unchanged y-o-y.
EBITDA for FY 2019 increased by 0.9% y-o-y to RUB 75.6 bln (USD 1.2 bln). EBITDA growth for the year was weaker due to record low prices in 4Q 2019, resulting in a 39.7% y-o-y decrease in EBITDA for 4Q 2019 to RUB 11.2 bln (USD 176 mln). Despite this, EBITDA margin for FY 2019 remained a robust 30.5%.
Net profit adjusted for non-cash FX items for 2019 declined by 11.2% y-o-y to RUB 37.1 bln (USD 573 mln).
In 2019, net operating cash flow increased by 19.9% to RUB 71.6 bln (USD 1.1 bln), partly due to more efficient management of working capital.
Capital expenditure in 2019 amounted to RUB 36.0 bln (USD 555 mln), excluding capitalised repairs, which corresponds to 48% of EBITDA for the reporting period.
| Item | 2018 | 2019 | Change y-o-y, % |
|---|---|---|---|
| DAP/MAP | 77.9 | 77.9 | 0.1 |
| NPK(S) | 60.9 | 68.4 | 12.3 |
| Phosphate rock | 22.1 | 25.8 | 16.7 |
| Nitrogen fertilizers | 37.0 | 37.9 | 2.3 |
| 2018 | 2019 | Change y-o-y, % | |
|---|---|---|---|
| Revenue | 233,312 | 248,125 | 6.3 |
| EBITDA | 74,908 | 75,582 | 0.9 |
| EBITDA margin | 32.1 | 30.5 | |
| Net profit | 22,135 | 49,408 | 123.2 |
| Adjusted net profit | 41,748 | 37,062 | −11.2 |
| 31 December 2018 | 31 December 2019 | ||
| Net debt | 135,330 | 131,583 | −2.8 |
| ND/LTM EBITDA | 1.81х | 1.74х | |
| Sales, kt | 2018 | 2019 | Change y-o-y, % |
| Phosphate-based fertilizers | 6,636 | 7,258 | 9.4 |
| Nitrogen fertilizers | 2,203 | 2,197 | −0.3 |
| Total sales | 8,839 | 9,455 | 7.0 |
The net debt/EBITDA ratio improved from 1.8x to 1.7x as at 31 December 2019, reflecting EBITDA growth and the appreciation of the rouble against the US dollar in 2019. As at 31 December 2019, net debt amounted to RUB 131.6 bln (USD 2.1 bln).
In 2019, cost of sales went up by 9.9% y-o-y to RUB 136.2 bln (USD 2.1 bln), mainly due to rising potash prices, as well as an accelerated increase in phosphate rock and fertilizer production. Other contributors included one-off payroll and electricity expenses.
Costs for materials and services in 2019 rose by 10.5% y-o-y and amounted to RUB 41.2 bln (USD 637 mln) as a result of:
- a 12.6% increase in the cost of phosphate rock transportation to RUB 8.6 bln (USD 133 mln) as a result of higher production volumes and a 4% rise in railway tariffs;
- a 6.7% y-o-y increase in repair expenses to RUB 10.1 bln (USD 156 mln) driven by cost inflation during the year and expansion of production capacities following the completion of the Company’s long-term investment programme at the end of 2018;
- a 39.8% y-o-y increase in drilling and blasting expenses to RUB 2.3 bln (USD 36 mln) due to accelerated mine development.
In 2019, costs for raw materials went up by 7.3% y-o-y to RUB 43.2 bln (USD 667 mln) driven by:
- a 33.7% y-o-y increase in potash costs to RUB 13.7 bln (USD 211 mln) mainly due to higher purchase prices for potassium compared to the previous year;
- a 4.4% y-o-y increase in natural gas expenses to RUB 12.6 bln (USD 195 mln) as a result of 3.7% y-o-y growth in ammonia production and higher sales of nitrogen fertilizers;
- an 18.6% y-o-y rise in costs for ammonium sulphate to RUB 3.6 bln (USD 55 mln) mainly due to an increase in the production of fertilizer grades containing sulphate;
- a reduction in costs for sulphur and sulphuric acid limited the increase in raw materials expenses. These costs decreased by 14.2% y-o-y to RUB 9.2 bln (USD 142 mln) mainly due to lower prices for sulphur and sulphuric acid.
Electricity costs rose by 13.3% y-o-y and stood at RUB 6.2 bln (USD 196 mln) mainly due to a nationwide programme to modernise the electricity industry (CDA 2), which led to a 15.0% y-o-y increase in the purchase price.
Administrative expenses for 2019 went up by 15.5% y-o-y and amounted to RUB 16.5 bln (USD 255 mln), driven mainly by a 17.6% increase in expenses for salaries and social contributions to RUB 9.3 bln (USD 144 mln).
In 2019, selling expenses showed a 9.3% y-o-y growth and stood at RUB 38.1 bln (USD 589 mln). The main factors behind the growth were:
- a 10.4% y-o-y increase in expenses on Russian Railways services and operators’ fees to RUB 11.4 bln (USD 177 mln) on the back of an overall sales growth and higher railway tariffs;
- a 2.9% y-o-y increase in freight, port and stevedoring expenses to RUB 18.3 bln (USD 283 mln), mainly due to higher freight tariffs;
- a 36.4% y-o-y increase in spending on customs duties to RUB 1.9 bln (USD 29 mln) reflecting changes in the delivery terms to the European market.
| 2018 | 2019 | Change, % | |
|---|---|---|---|
| Depreciation and amortisation | 18,936 | 21,368 | 12.8 |
| Materials and services | 37,306 | 41,221 | 10.5 |
| 7,671 | 8,641 | 12.6 |
| 9,485 | 10,119 | 6.7 |
| 1,662 | 2,323 | 39.8 |
| 18,488 | 20,138 | 8.9 |
| Raw materials | 40,226 | 43,155 | 7.3 |
| 4,195 | 4,095 | −2.4 |
| 10,682 | 9,165 | −14.2 |
| 10,238 | 13,691 | 33.7 |
| 12,096 | 12,627 | 4.4 |
| 3,015 | 3,577 | 18.6 |
| Salaries and social contributions | 11,760 | 12,744 | 8.4 |
| Electricity | 5,474 | 6,204 | 13.3 |
| Fuel | 4,019 | 4,849 | 20.7 |
| Products for resale | 6,287 | 6,683 | 6.3 |
| Total | 124,008 | 136,224 | 9.9 |
| Item | Stakeholder | 2018The 2018 numbers in this table differ from those disclosed in the same table in the 2018 Report due to the adjustments made to both 2018 accounts and calculation methods. | 2019 |
|---|---|---|---|
| Direct economic value generated | 233,759 | 249,583 | |
| Revenue from sales | Wide range of stakeholders | 223,982 | 239,130 |
| Revenue from other sales | 9 330 | 8,995 | |
| Revenue from financial investments | 447 | 1,458 | |
| Revenue from sale of assets | 0 | 0 | |
| Economic value distributed | −206,785 | −243,077 | |
| Operating expenses, including: | Suppliers and contractors | −175,846 | −194,090 |
| Wages and other payments to employees | Employees | −21,924 | −24,706 |
| Social expenses | −2,139 | −2,807 | |
| Payments to providers of capital | Shareholders and creditors | ||
| Payments to shareholders | −13,598 | −32,244 | |
| Payments to creditors | −5,385 | −4,635 | |
| Tax expenses and other payments to government | Government | −11,956 | −12,108 |
| Including income tax expense | −8,487 | −9,724 | |
| Economic value retained | 26,974 | 6,506 | |